Help us make the FRA website better for you!
Take part in a one-to-one session and help us improve the FRA website. It will take about 30 minutes of your time.
Roma and Travellers survey
Different visualisation tools
This interactive tool offers different ways to explore the data behind the survey results. There are four main visualisation options: Bar chart, Country survey group detail and Country survey group comparison, as well as a Data table option that shows the data for the selected visualisation.
Bar chart

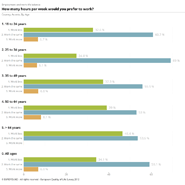
The bar chart visualisation illustrates the results for all survey groups as well as the EU5 total and the EU5 + UK total average as a horizontal stacked bar chart.
Country survey group detail

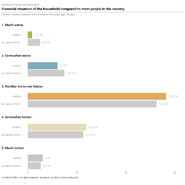
The country survey group detail visualisation presents the values for all answer categories for the selected group, survey question and subset of respondents. The horizontal bar charts include the EU5 total and the EU5 + UK total averages.
Country survey group comparison

The country survey group comparison visualisation presents a comparative overview of the results for two or more selected countries. Country survey group results can also be compared with the EU5 total and the EU5 + UK total averages across answer categories.
Data table

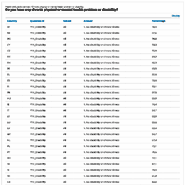
The data table presents the data of the selected visualisation in a numerical format.
How to explore the data
The survey questions are divided into nine topics and each topic has a number of questions. Choose a topic, then a question from the drop-down list in the grey box. You can also apply additional filters. You can also change the visualisation using the list of options on the right hand side of the chart or map.
How to export the data
The export options can be accessed via the Export button. To export the visualisation as an image, choose one of Figure (PNG), FSVG (High resolution), EPS (High resolution) or PDF (High resolution). To export the data for the selected visualisation in Microsoft Excel format, choose XLSX. To generate a Page URL or Embeddable HTML choose the corresponding option.
FRA’s 2019 survey on Roma and Travellers in Belgium, France, Ireland, the Netherlands, Sweden and the United Kingdom interviewed almost 4 700 Roma and Travellers, collecting information on more than 8 200 individuals living in their households.
The previous data collection exercises on Roma, under the second European Union Minorities and Discrimination Survey (EU-MIDIS II), did not cover these countries.
The overall aim of the survey is to support and contribute to the efforts of EU institutions and Member States towards “putting an end to the exclusion of Roma”, which the European Commission has acknowledged as “one of the most serious social challenges in Europe”. Its findings provide evidence for a list of core indicators used to monitor the implementation of the EU Framework for National Roma Integration Strategies up to 2020. They also provide a basis for developing new indicators, as a baseline for post-2020 EU initiatives on Roma equality and inclusion. FRA’s input responds to the need for strengthened data collection and the development of monitoring and reporting systems, which the same evaluation report identifies in its conclusions. The Commission has published a roadmap towards the EU’s post-2020 Roma equality and inclusion policy, which refers to FRA’s previous surveys on Roma in 2011 and 2016 and requests further evidence.14 This roadmap is likely to lead to a proposal for a revised Council recommendation on Roma equality and inclusion measures accompanied by a communication presenting the post-2020 EU strategic framework.
Interviews were conducted face to face, with trained interviewers using a computerised questionnaire. The survey targeted individuals aged 16 or over who self-identified as having a Roma or Traveller background (or any group subsumed under these umbrella terms), who lived in private households and whose usual place of residence was the survey country for at least six of the 12 months before the survey. The survey collected information from 4 659 respondents in Belgium, France, Ireland, the Netherlands, Sweden and the United Kingdom and concerning 8 234 individuals living in the respondents’ households (i.e. 12 893 Roma and Travellers in total) and about the infrastructure of the halting site or neighbourhood 7 . The fieldwork took place from December 2018 until July 2019 through face-to-face interviews. The results of the survey are published in the main results report, Roma and Travellers in Six Countries.
The FRA data visualization tool is designed to work in all modern browsers such as Google Chrome, Apple Safari, Mozilla's Firefox and Microsoft Edge. If you are using an old browser such Internet Explorer 11 or earlier, we recommend that you either upgrade to Edge or use instead the latest version of one of the other browsers listed above.
Accessibility
We are committed to making this site as accessible as possible for all users, including those with disabilities. For more details, please see our accessibility section.