Help us make the FRA website better for you!
Take part in a one-to-one session and help us improve the FRA website. It will take about 30 minutes of your time.
Survey on Minorities and Discrimination in EU (2016)
Different visualisation tools
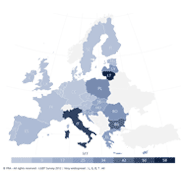
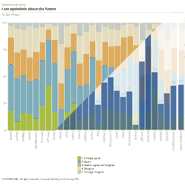
This interactive tool offers different ways to explore the data behind the survey results. There are four main visualisation options: Map, Bar chart, Country detail and Country comparison, as well as a Data table option that shows the data for the selected visualisation.
How to explore the data
The survey questions are divided into eight topics and each topic has a number of questions. Choose a topic, then a question from the drop-down list in the gray box, and the target group. You can also apply additional filters. Survey results can be filtered by respondents’ age, gender and between first- and second-generation immigrants. You can also change the visualisation using the list of options on the right hand side of the chart or map.
How to export the data
The export options can be accessed via the Export button. To export the visualisation as an image, choose one of Figure (PNG), Figure (High resolution), EPS (High resolution) or PDF (High resolution). To export the data for the selected visualisation in Microsoft Excel format, choose Data (XLS). To generate a Page URL, Embeddable HTML or a Page citation, choose the corresponding option.
The survey is based on face-to-face interviews with 25,515 respondents with different ethnic minority and immigrant backgrounds across all 28 EU Member States.
The survey was carried out between October 2015 to July 2016. It contains questions on perceived discrimination in different settings, such as employment, education, housing, health and when using public or private services. It also covers police stops, criminal victimisation (including hate crime) as well as awareness of rights and where to go for help. In addition respondents were asked about societal participation and integration, including trust in public institutions and level of attachment to the country of residence.
The sample includes people belonging to ethnic or national minorities, Roma and Russians, as well as people born outside the EU (first-generation respondents), and individuals with at least one parent born outside the EU (second-generation respondents). Immigrants and descendants of immigrants came from Turkey, North Africa, Sub-Saharan Africa, and South Asia (in Cyprus, Asia); in Slovenia and Poland, individuals who immigrated from any non-EU country in the past 10 years were included. . All respondents were aged 16 years or older, and had lived in private households for at least 12 months before the survey. While immigrants and descendants of immigrants were included in the survey based on their and their parents’ country of birth, respectively, ethnic minorities were included based on self-identification.
The sample size per target group in each country ranged from 369 immigrants and descendants of immigrants from Sub-Saharan Africa in Italy to 1,408 Roma in Romania.
The countries of origin for each target group were selected based on considerations with respect to their vulnerability of being discriminated against. The detailed list of countries of origin are listed in the separately published EU-MIDIS II Technical Report. The countries included in EU-MIDIS II per target group cover most immigrants from these respective groups. The six countries covered in EU-MIDIS II with respect to Turkish immigrants host 82% of all immigrants from Turkey in the EU, with most settled in Germany. The countries selected for Sub-Saharan African immigrants host roughly 86% of immigrants from this region. The selected EU-MIDIS II countries host about 92% of North African immigrants and about 69% of South Asian immigrants in the EU.
A full list of reports produced from the survey data:
- Roma – Selected findings (November 2016)
- Muslims – Selected findings (September 2017)
- Main results (December 2017)
- Technical report (December 2017)
- Transition from education to employment of young Roma in nine EU Member States (July 2018)
- Being Black in the EU (November 2018)
- Roma women in nine EU Member States (April 2019)
- Migrant women - selected findings (September 2019)
- Being Black in the EU - Summary (November 2019) - Available in Danish, English, Finnish, French, German, Italian, Maltese, Portuguese, Swedish,
The FRA data visualization tool is designed to work in all modern browsers such as Microsoft Internet Explorer 9+, as well as recent versions of Mozilla Firefox, Google Chrome, Apple Safari and Opera. If you are using an old browser such Internet Explorer 8 or earlier, we recommend that you either upgrade to version 9+ or use instead the latest version of one of the other browsers listed above.
Accessibility
We are committed to making this site as accessible as possible for all users, including those with disabilities. For more details, please see our accessibility section.
About this survey
Second European Union Minorities and Discrimination Survey
